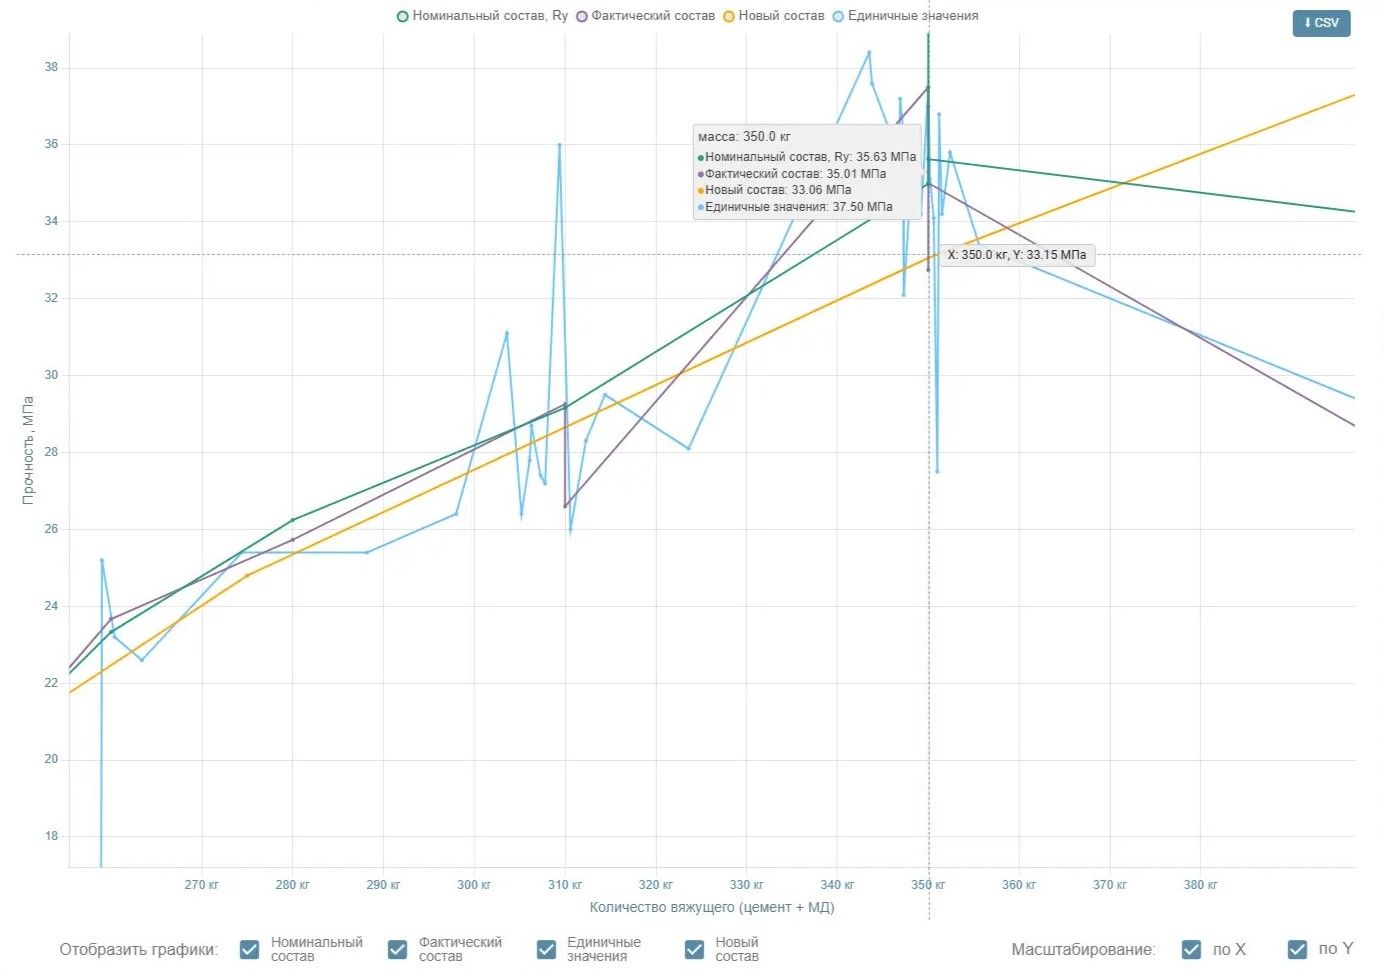
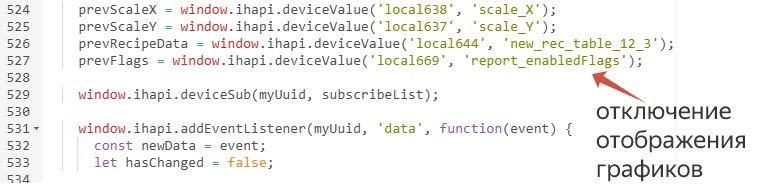
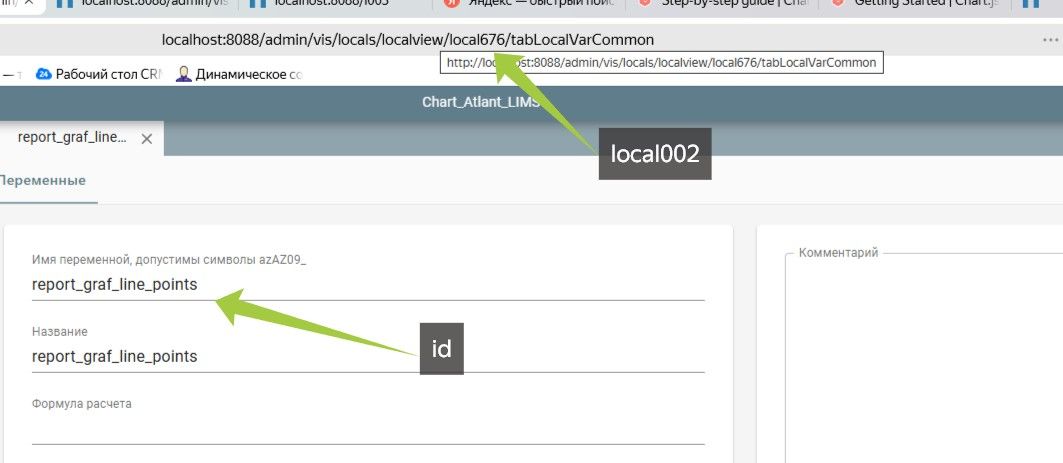
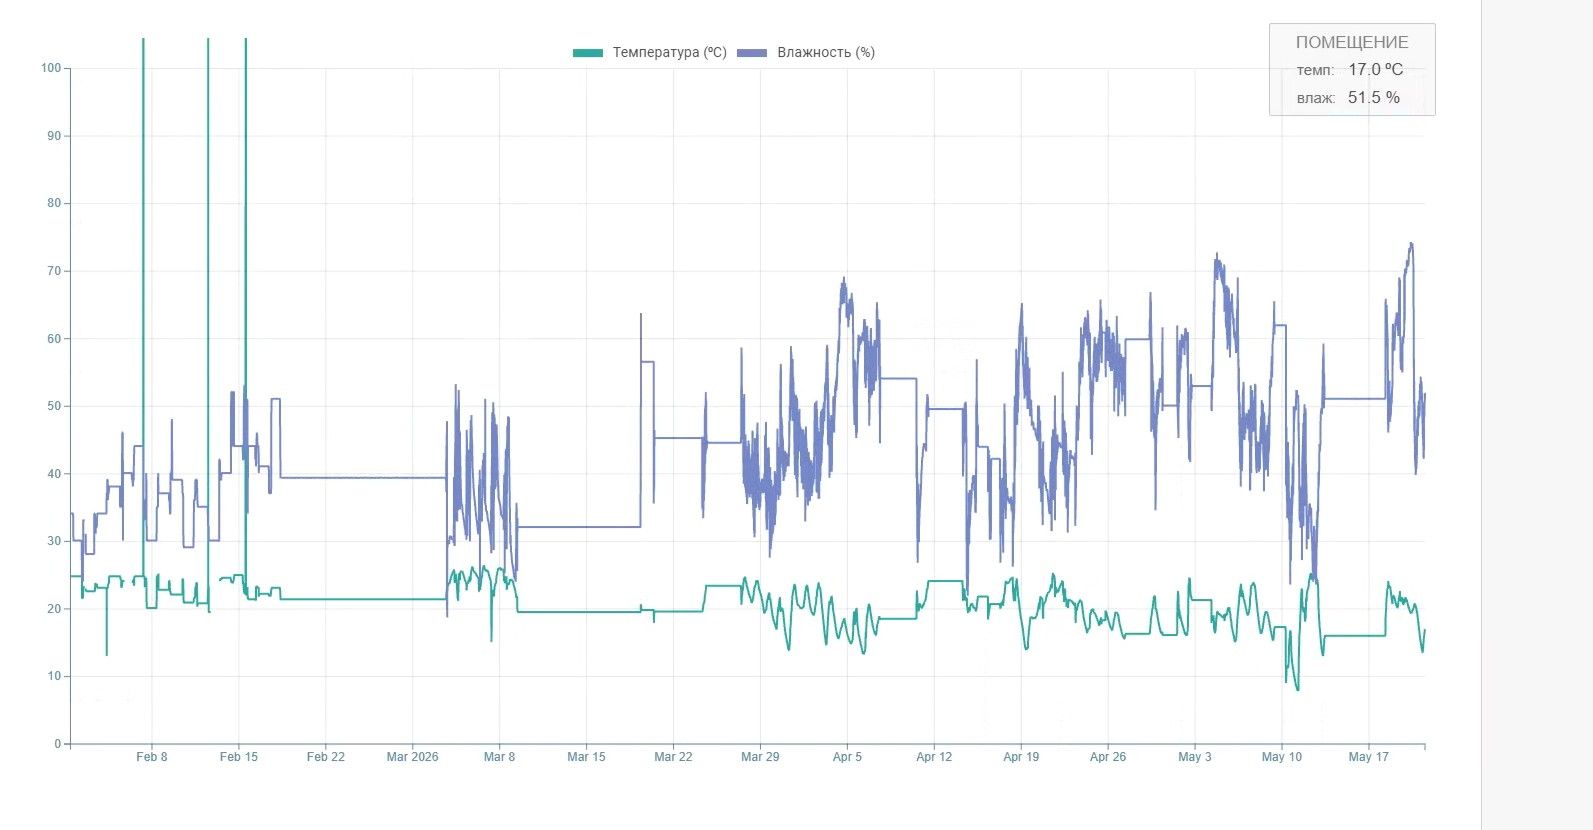
Добавил в версию при отсутствии интернета или доступа к внешним ресурсам загружать библиотеки с папки \anyfiles
<style type="text/css">
  /* ===== Стили для контейнера и canvas ===== */
  #${uuid} {
    height: 100%;
    width: 100%;
    position: relative;
  }
  #${uuid} canvas {
    width: 100% !important;
    height: 100% !important;
    display: block;
  }
</style>

<div id="${uuid}">
  <canvas id="myChart"></canvas>
  <button id="exportCsvBtn" style="position: absolute; top: 10px; right: 10px; z-index: 20; padding: 6px 12px; background: #5889A5; color: #fff; border: none; border-radius: 4px; cursor: pointer; font-size: 13px;">
    ⬇ CSV
  </button>
</div>

<script type="text/javascript">
  // ===== Глобальные переменные =====
  let updateTimeout = null;
  let isRendering = false;
  let chartInstance = null;
  let crosshair = null;
  let isSubscribed = false;

  // ===== Экспорт данных в CSV (разделитель ";" с BOM) =====
  function exportChartDataToCSV() {
    if (!chartInstance) {
      console.warn('График ещё не создан');
      return;
    }

    const datasets = chartInstance.data.datasets;
    if (!datasets || datasets.length === 0) {
      console.warn('Нет данных для экспорта');
      return;
    }

    const xValues = new Set();
    datasets.forEach(ds => {
      ds.data.forEach(point => {
        if (point.x !== undefined && point.x !== null) {
          xValues.add(point.x);
        }
      });
    });

    const sortedX = Array.from(xValues).sort((a, b) => a - b);

    const headers = ['Масса, кг'];
    datasets.forEach(ds => {
      headers.push(ds.label || 'Без названия');
    });

    const rows = [];
    sortedX.forEach(x => {
      const row = [x];
      datasets.forEach(ds => {
        const point = ds.data.find(p => p.x === x);
        row.push(point && point.y !== undefined && point.y !== null ? point.y : '');
      });
      rows.push(row);
    });

    const csvContent = [
      headers.join(';'),
      ...rows.map(row => row.join(';'))
    ].join('\n');

    const bom = '\uFEFF';
    const blob = new Blob([bom + csvContent], { type: 'text/csv;charset=utf-8;' });
    const link = document.createElement('a');
    link.href = URL.createObjectURL(blob);
    link.download = `chart_data_${new Date().toISOString().slice(0,10)}.csv`;
    document.body.appendChild(link);
    link.click();
    document.body.removeChild(link);
    URL.revokeObjectURL(link.href);
    console.log('CSV файл успешно скачан (разделитель ";", с BOM)');
  }

  // ===== КАСТОМНОЕ ПЕРЕКРЕСТИЕ (с поддержкой изменения размера окна) =====
  function enableCrosshair(chart) {
    if (!chart) return;

    // Удаляем старое перекрестие, если есть
    if (crosshair) {
      if (crosshair.vLine) {
        crosshair.vLine.remove();
        crosshair.hLine.remove();
        crosshair.label.remove();
      }
      if (crosshair.resizeHandler) {
        window.removeEventListener('resize', crosshair.resizeHandler);
      }
      if (crosshair.resizeObserver) {
        crosshair.resizeObserver.disconnect();
      }
      crosshair = null;
    }

    const canvas = chart.canvas;
    if (!canvas) {
      console.warn('Canvas отсутствует');
      return;
    }
    const container = canvas.parentNode;
    if (!container) {
      console.warn('Контейнер canvas не найден');
      return;
    }
    container.style.position = 'relative';

    // Создаём элементы перекрестия
    const vLine = document.createElement('div');
    vLine.style.cssText = `
      position: absolute; top: 0; left: 0;
      height: 100%;
      border-left: 1px dashed rgba(88, 137, 165, 0.7);
      pointer-events: none; display: none;
      z-index: 10;
    `;
    container.appendChild(vLine);

    const hLine = document.createElement('div');
    hLine.style.cssText = `
      position: absolute; top: 0; left: 0;
      width: 100%;
      border-top: 1px dashed rgba(88, 137, 165, 0.7);
      pointer-events: none; display: none;
      z-index: 10;
    `;
    container.appendChild(hLine);

    const label = document.createElement('div');
    label.style.cssText = `
      position: absolute;
      background: rgba(235,235,235,0.85);
      padding: 2px 8px; border-radius: 4px;
      font-size: 12px; pointer-events: none;
      display: none; white-space: nowrap;
      border: 1px solid #ccc;
      z-index: 11;
    `;
    container.appendChild(label);

    crosshair = { vLine, hLine, label };

    // Храним относительные координаты (в долях от размера canvas)
    let lastXPercent = -1;
    let lastYPercent = -1;
    let isMouseInside = false;

    function updateCrosshairPosition(x, y) {
      if (!crosshair || !crosshair.vLine) return;

      const rect = canvas.getBoundingClientRect();
      if (x < 0 || y < 0 || x > rect.width || y > rect.height || !isMouseInside) {
        crosshair.vLine.style.display = 'none';
        crosshair.hLine.style.display = 'none';
        crosshair.label.style.display = 'none';
        return;
      }
      crosshair.vLine.style.display = 'block';
      crosshair.vLine.style.left = x + 'px';
      crosshair.hLine.style.display = 'block';
      crosshair.hLine.style.top = y + 'px';

      const xScale = chart.scales.x;
      const yScale = chart.scales.y;
      if (xScale && yScale) {
        const xVal = xScale.getValueForPixel(x);
        const yVal = yScale.getValueForPixel(y);
        if (xVal !== undefined && yVal !== undefined) {
          crosshair.label.style.display = 'block';
          crosshair.label.textContent = `X: ${xVal.toFixed(1)} кг, Y: ${yVal.toFixed(2)} МПа`;
          let lx = x + 10, ly = y - 10;
          if (lx + 200 > rect.width) lx = x - 200;
          if (ly < 0) ly = 0;
          crosshair.label.style.left = lx + 'px';
          crosshair.label.style.top = ly + 'px';
        } else {
          crosshair.label.style.display = 'none';
        }
      }
    }

    function onMouseMove(e) {
      const rect = canvas.getBoundingClientRect();
      const x = e.clientX - rect.left;
      const y = e.clientY - rect.top;
      // Сохраняем относительные координаты
      lastXPercent = x / rect.width;
      lastYPercent = y / rect.height;
      isMouseInside = true;
      updateCrosshairPosition(x, y);
    }

    function onMouseLeave() {
      isMouseInside = false;
      if (crosshair) {
        crosshair.vLine.style.display = 'none';
        crosshair.hLine.style.display = 'none';
        crosshair.label.style.display = 'none';
      }
    }

    // Обработчик изменения размера окна или контейнера
    function onResize() {
      if (isMouseInside && lastXPercent >= 0 && lastYPercent >= 0 && crosshair) {
        // Обновляем размеры canvas
        chart.resize();
        // Даём время на пересчёт размеров
        setTimeout(() => {
          const rect = canvas.getBoundingClientRect();
          const x = lastXPercent * rect.width;
          const y = lastYPercent * rect.height;
          updateCrosshairPosition(x, y);
        }, 30);
      }
    }

    canvas.addEventListener('mousemove', onMouseMove);
    canvas.addEventListener('mouseleave', onMouseLeave);
    window.addEventListener('resize', onResize);

    // Наблюдатель за изменением размера контейнера (для случаев, когда окно не меняется, а контейнер — да)
    const resizeObserver = new ResizeObserver(() => {
      onResize();
    });
    resizeObserver.observe(container);

    // Сохраняем ссылки для очистки
    chart._crosshairHandlers = { onMouseMove, onMouseLeave, onResize };
    crosshair.resizeHandler = onResize;
    crosshair.resizeObserver = resizeObserver;
  }

  // ===== ОСНОВНАЯ ФУНКЦИЯ (debounce) =====
  function drawChart(canvasId) {
    if (isRendering) return;
    if (updateTimeout) {
      clearTimeout(updateTimeout);
      updateTimeout = null;
    }
    updateTimeout = setTimeout(() => {
      updateTimeout = null;
      performRender(canvasId);
    }, 150);
  }

  // ===== РЕАЛЬНЫЙ РЕНДЕРИНГ =====
  function performRender(canvasId) {
    if (isRendering) return;
    isRendering = true;

    try {
      const canvas = document.getElementById(canvasId);
      if (!canvas) { console.warn('Canvas not found'); return; }
      const context = canvas.getContext('2d');
      if (!context) { console.warn('Canvas context missing'); return; }

      const dataObj = window.ihapi.deviceValue('local676', 'report_graf_line_points');
      if (!dataObj || !dataObj.items || dataObj.items.length === 0) {
        console.warn('Нет данных');
        return;
      }

      const scaleXVal = window.ihapi.deviceValue('local638', 'scale_X');
      const scaleYVal = window.ihapi.deviceValue('local637', 'scale_Y');
      const isScaleX = scaleXVal == true || scaleXVal == 'true';
      const isScaleY = scaleYVal == true || scaleYVal == 'true';
      let mode = 'xy';
      if (isScaleX && !isScaleY) mode = 'x';
      else if (!isScaleX && isScaleY) mode = 'y';
      else if (!isScaleX && !isScaleY) mode = 'none';

      let zoomConfig = {
        pan: { enabled: false },
        zoom: { wheel: { enabled: false } }
      };
      if (mode !== 'none') {
        zoomConfig = {
          pan: { enabled: true, mode: mode },
          zoom: { wheel: { enabled: true }, mode: mode },
          limits: {
            x: { min: dataObj.start, max: dataObj.end },
            y: { min: dataObj.min, max: dataObj.max }
          }
        };
      }

      const datasets = [];
      for (const item of dataObj.items) {
        if (!item.visible) continue;
        const points = item.points.map(p => ({
          x: parseFloat(p.x),
          y: parseFloat(p.y)
        }));
        datasets.push({
          label: item.legend || 'Без названия',
          data: points,
          fill: false,
          borderColor: item.lineColor || '#000000',
          borderWidth: parseInt(item.lineWidth) || 2,
          tension: 0.0,
          pointRadius: 1.0,
          pointStyle: 'circle',
        });
      }
      if (datasets.length === 0) {
        console.warn('Нет видимых линий');
        return;
      }

      if (chartInstance) {
        // === ОБНОВЛЕНИЕ ===
        chartInstance.data.datasets = datasets;
        chartInstance.options.scales.x.min = dataObj.start;
        chartInstance.options.scales.x.max = dataObj.end;
        chartInstance.options.scales.y.min = dataObj.min;
        chartInstance.options.scales.y.max = dataObj.max;
        chartInstance.options.plugins.zoom = zoomConfig;
        chartInstance.update();
        console.log('График обновлён (zoom: ' + mode + ')');
      } else {
        // === ПЕРВОЕ СОЗДАНИЕ ГРАФИКА ===
        const config = {
          type: 'line',
          data: { datasets },
          options: {
            responsive: true,
            maintainAspectRatio: false,
            animation: false,
            scales: {
              x: {
                type: 'linear',
                min: dataObj.start,
                max: dataObj.end,
                ticks: {
                  autoSkip: true,
                  maxRotation: 0,
                  callback: (val, index, ticks) =>
                    index === 0 || index === ticks.length - 1 ? null : `${Number(val.toFixed(3))} кг`,
                  color: '#5889A5',
                  font: { size: 12 },
                  maxTicksLimit: 20
                },
                grid: { display: true, color: 'rgba(0,0,0,0.1)', lineWidth: 1 },
                border: { color: '#5889A540', lineWidth: 1 },
                title: {
                  display: true,
                  text: 'Количество вяжущего (цемент + МД)',
                  color: '#5C7C8F',
                  font: { size: 14 }
                }
              },
              y: {
                min: dataObj.min,
                max: dataObj.max,
                ticks: {
                  callback: (val, index, ticks) =>
                    index === 0 || index === ticks.length - 1 ? null : Number(val.toFixed(3)),
                  color: '#5889A5',
                  font: { size: 12 },
                  maxTicksLimit: 20
                },
                grid: { display: true, color: 'rgba(0,0,0,0.1)', lineWidth: 1 },
                border: { color: '#5889A540', lineWidth: 1 },
                title: {
                  display: true,
                  text: 'Прочность, МПа',
                  color: '#5C7C8F',
                  font: { size: 14 }
                }
              }
            },
            plugins: {
              zoom: zoomConfig,
              tooltip: {
                mode: 'nearest',
                axis: 'x',
                intersect: false,
                backgroundColor: '#F0F0F0',
                titleColor: '#444444',
                titleFont: { size: 13, weight: 'normal' },
                bodyColor: '#444444',
                borderColor: '#CCCCCC',
                borderWidth: 1,
                cornerRadius: 2,
                padding: 5,
                usePointStyle: true,
                boxWidth: 5,
                boxHeight: 5,
                callbacks: {
                  title: function(tooltipItems) {
                    const x = tooltipItems[0].parsed.x;
                    return `масса: ${x.toFixed(1)} кг`;
                  },
                  label: function(context) {
                    let label = context.dataset.label || '';
                    if (label) label += ': ';
                    if (context.parsed.y !== null) {
                      label += context.parsed.y.toFixed(2) + ' МПа';
                    }
                    return label;
                  },
                  labelPointStyle: function(context) {
                    return { pointStyle: 'circle' };
                  },
                  labelColor: function(context) {
                    return {
                      borderColor: context.dataset.borderColor,
                      backgroundColor: context.dataset.borderColor,
                      borderWidth: 0,
                      borderRadius: 2
                    };
                  }
                }
              },
              legend: {
                labels: {
                  boxWidth: 7,
                  boxHeight: 7,
                  usePointStyle: true,
                  font: { size: 13 }
                }
              }
            }
          }
        };

        chartInstance = new Chart(context, config);

        // Принудительная установка размеров
        const container = canvas.parentNode;
        container.style.height = '100%';
        container.style.width = '100%';
        container.style.overflow = 'hidden';
        canvas.style.height = '100%';
        canvas.style.width = '100%';
        canvas.style.display = 'block';
        chartInstance.resize();

        // Вызываем enableCrosshair только один раз
        enableCrosshair(chartInstance);
        console.log('График успешно создан (zoom: ' + mode + ')');

        if (!isSubscribed) {
          setTimeout(initSubscriptions, 100);
        }
      }
    } catch (err) {
      console.error('Ошибка при рендеринге:', err);
    } finally {
      isRendering = false;
    }
  }

  // ===== ЗАГРУЗКА ПЛАГИНА ZOOM =====
  function loadZoomPlugin() {
  // Проверяем, не загружен ли уже плагин (чтобы избежать дублирования)
  if (document.getElementById('chartjs-plugin-zoom')) {
    drawChart('myChart');
    return;
  }

  const pluginScript = document.createElement('script');
  pluginScript.id = 'chartjs-plugin-zoom';
  pluginScript.src = 'https://cdn.jsdelivr.net/npm/chartjs-plugin-zoom';
  document.head.appendChild(pluginScript);

  pluginScript.addEventListener('load', function () {
    console.log('Плагин zoom загружен');
    drawChart('myChart');
  });

  pluginScript.addEventListener('error', function () {
    console.warn('Ошибка загрузки плагина zoom с CDN, пробуем локальную версию');
    const localPlugin = document.createElement('script');
    localPlugin.id = 'chartjs-plugin-zoom';
    localPlugin.src = '/files/chartjs-plugin-zoom.js'; // путь к локальной копии
    document.head.appendChild(localPlugin);

    localPlugin.addEventListener('load', function () {
      console.log('Плагин zoom загружен локально');
      drawChart('myChart');
    });
    localPlugin.addEventListener('error', function () {
      console.error('Не удалось загрузить плагин zoom');
    });
  });
}

  // ===== ЗАГРУЗКА ОСНОВНОГО СКРИПТА =====
 function loadScripts() {
  const chartScript = document.getElementById('chart-js');
  if (!chartScript) {
    const script = document.createElement('script');
    script.id = 'chart-js';
    console.log('Текущий хост:', window.location.hostname);
    // Сначала пробуем загрузить с CDN
    script.src = 'https://cdn.jsdelivr.net/npm/chart.js';
    document.head.appendChild(script);

    script.addEventListener('load', function () {
      loadZoomPlugin();
    });

    script.addEventListener('error', function () {
      console.warn('Ошибка загрузки Chart.js с CDN, пробуем локальную версию');
      // Если CDN недоступен, загружаем локальный файл
      const localScript = document.createElement('script');
      localScript.id = 'chart-js'; // тот же ID, чтобы не дублировать
      localScript.src = '/files/chart.js'; // путь к локальной копии
      document.head.appendChild(localScript);

      localScript.addEventListener('load', function () {
        loadZoomPlugin();
      });
      localScript.addEventListener('error', function () {
        console.error('Не удалось загрузить Chart.js ни с CDN, ни локально');
      });
    });
  } else {
    if (!document.getElementById('chartjs-plugin-zoom')) {
      loadZoomPlugin();
    } else {
      drawChart('myChart');
    }
  }
}

  // ===== Подписка на изменения локальных переменных =====
  let prevScaleX = null;
  let prevScaleY = null;
  let prevRecipeData = null;
  let prevFlags = null;

  function initSubscriptions() {
    if (isSubscribed) {
      console.warn('Подписка уже создана, пропускаем');
      return;
    }

    const myUuid = '${uuid}';
    const subscribeList = [
      'local638_scale_X',
      'local637_scale_Y',
      'local644_new_rec_table_12_3',
      'local669_report_enabledFlags'
    ];

    console.log('Вызов initSubscriptions');

    prevScaleX = window.ihapi.deviceValue('local638', 'scale_X');
    prevScaleY = window.ihapi.deviceValue('local637', 'scale_Y');
    prevRecipeData = window.ihapi.deviceValue('local644', 'new_rec_table_12_3');
    prevFlags = window.ihapi.deviceValue('local669', 'report_enabledFlags');

    window.ihapi.deviceSub(myUuid, subscribeList);

    window.ihapi.addEventListener(myUuid, 'data', function(event) {
      const newData = event;
      let hasChanged = false;

      subscribeList.forEach(key => {
        if (newData[key] !== undefined) {
          const currentVal = newData[key];
          if (key === 'local638_scale_X' && currentVal !== prevScaleX) {
            prevScaleX = currentVal;
            hasChanged = true;
          } else if (key === 'local637_scale_Y' && currentVal !== prevScaleY) {
            prevScaleY = currentVal;
            hasChanged = true;
          } else if (key === 'local644_new_rec_table_12_3' &&
                     JSON.stringify(currentVal) !== JSON.stringify(prevRecipeData)) {
            prevRecipeData = currentVal;
            hasChanged = true;
          } else if (key === 'local669_report_enabledFlags') {
            prevFlags = currentVal;
            hasChanged = true;
          }
        }
      });

      if (hasChanged) {
        console.log('Обнаружено изменение локальной переменной, обновляем график');
        drawChart('myChart');
      }
    });

    window.ihapi.addEventListener(myUuid, 'destroy', function() {
      window.ihapi.deviceUnsub(myUuid, subscribeList);
      console.log('Отписка от локальных переменных выполнена');
    });

    isSubscribed = true;
  }

  // ===== ИНИЦИАЛИЗАЦИЯ =====
  console.log('START');
  const scriptExists = document.getElementById('chart-js');

  const exportBtn = document.getElementById('exportCsvBtn');
  if (exportBtn) {
    exportBtn.addEventListener('click', exportChartDataToCSV);
  }

  if (!scriptExists) {
    loadScripts();
  } else {
    if (!document.getElementById('chartjs-plugin-zoom')) {
      loadZoomPlugin();
    } else {
      drawChart('myChart');
      setTimeout(initSubscriptions, 500);
    }
  }
</script>